
Kobi Lipari
Data analyst · Surveys · Dashboards
I make the numbers
explain themselves.
I keep thirty dashboards on one written spec, run the retention model advisers at my university work from each week, and run its Qualtrics surveys end to end: design, administration, analysis and the report people actually read.
Data, survey and BI work · New Orleans
The before-and-after comparison needs JavaScript. See the dashboards project.
- 30+dashboards on one written spec
- 15+data sources feeding one retention model
- Qualtrics surveys, from the first question to the report
- GitHub ↗
Featured work
All work →-
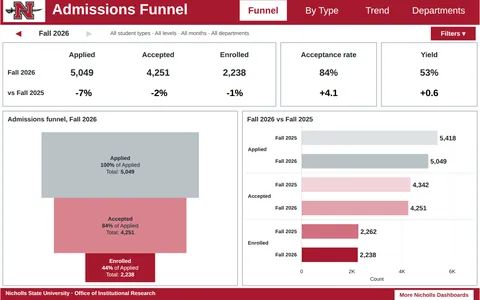 Tableau · Python · Access
Institutional Research Dashboards
Public Tableau dashboards moved onto one written design system.
Tableau · Python · Access
Institutional Research Dashboards
Public Tableau dashboards moved onto one written design system.
-
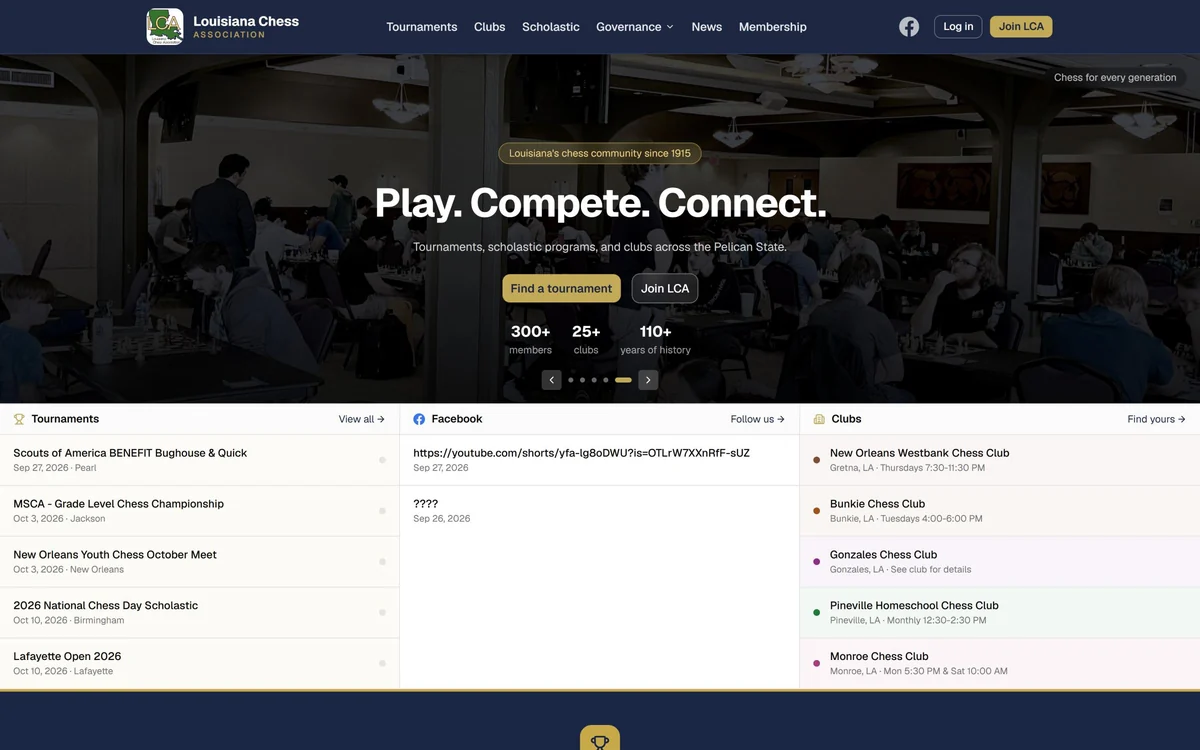 React · TypeScript · Cloudflare D1 · Stripe
LCA Website Platform
Built from scratch to replace Google Sites and a third-party registration site.
React · TypeScript · Cloudflare D1 · Stripe
LCA Website Platform
Built from scratch to replace Google Sites and a third-party registration site.
-
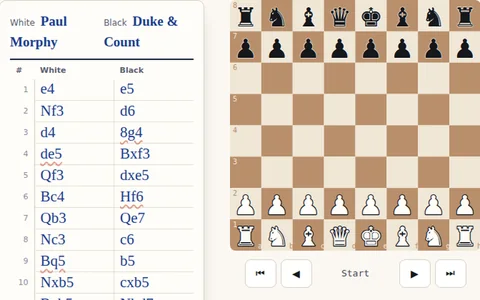 TypeScript · React · Cloudflare
Chess Scoresheet Scanner
Handwriting read verbatim, then corrected by the rules of chess.
TypeScript · React · Cloudflare
Chess Scoresheet Scanner
Handwriting read verbatim, then corrected by the rules of chess.
More work
See all 5 →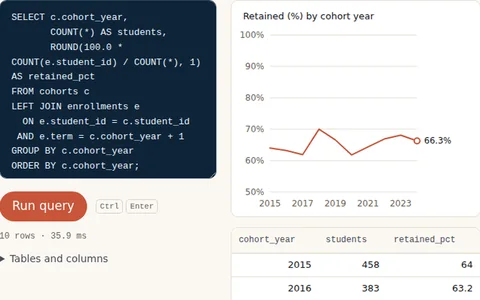

About
Right now I build the SQL, Access pipelines, and Tableau dashboards behind Nicholls State University's institutional reporting, and I'm the analyst faculty turn to for help with their research: finding the right data, running the analysis, and making the results clear. I also run the office's Qualtrics surveys end to end, from writing the questions to pulling the responses and writing up what they say. Part time, I build full-stack web platforms that members and patients use every day.
Two things from this year I would tell you about over coffee. A payment webhook on a volunteer-run site accepted unsigned calls until I noticed; I fixed it before launch and wrote the test that fails if anyone removes the check. And the retention model at Nicholls, the first its advisers have worked from, which I validated year over year before anyone saw a score.
- NOW
- Data Analyst, Nicholls State University
- ALSO
- Webmaster, Louisiana Chess Association
Web Developer & IT Support, Healingly - DEGREE
- BS Computer Science, University of Louisiana at Lafayette, 2024
- TOOLS
- SQL · Tableau · Qualtrics · Python · pandas · R · Excel · Power BI · Access · Git · JavaScript · HTML/CSS · Cloudflare